
Chartify
Links
Description
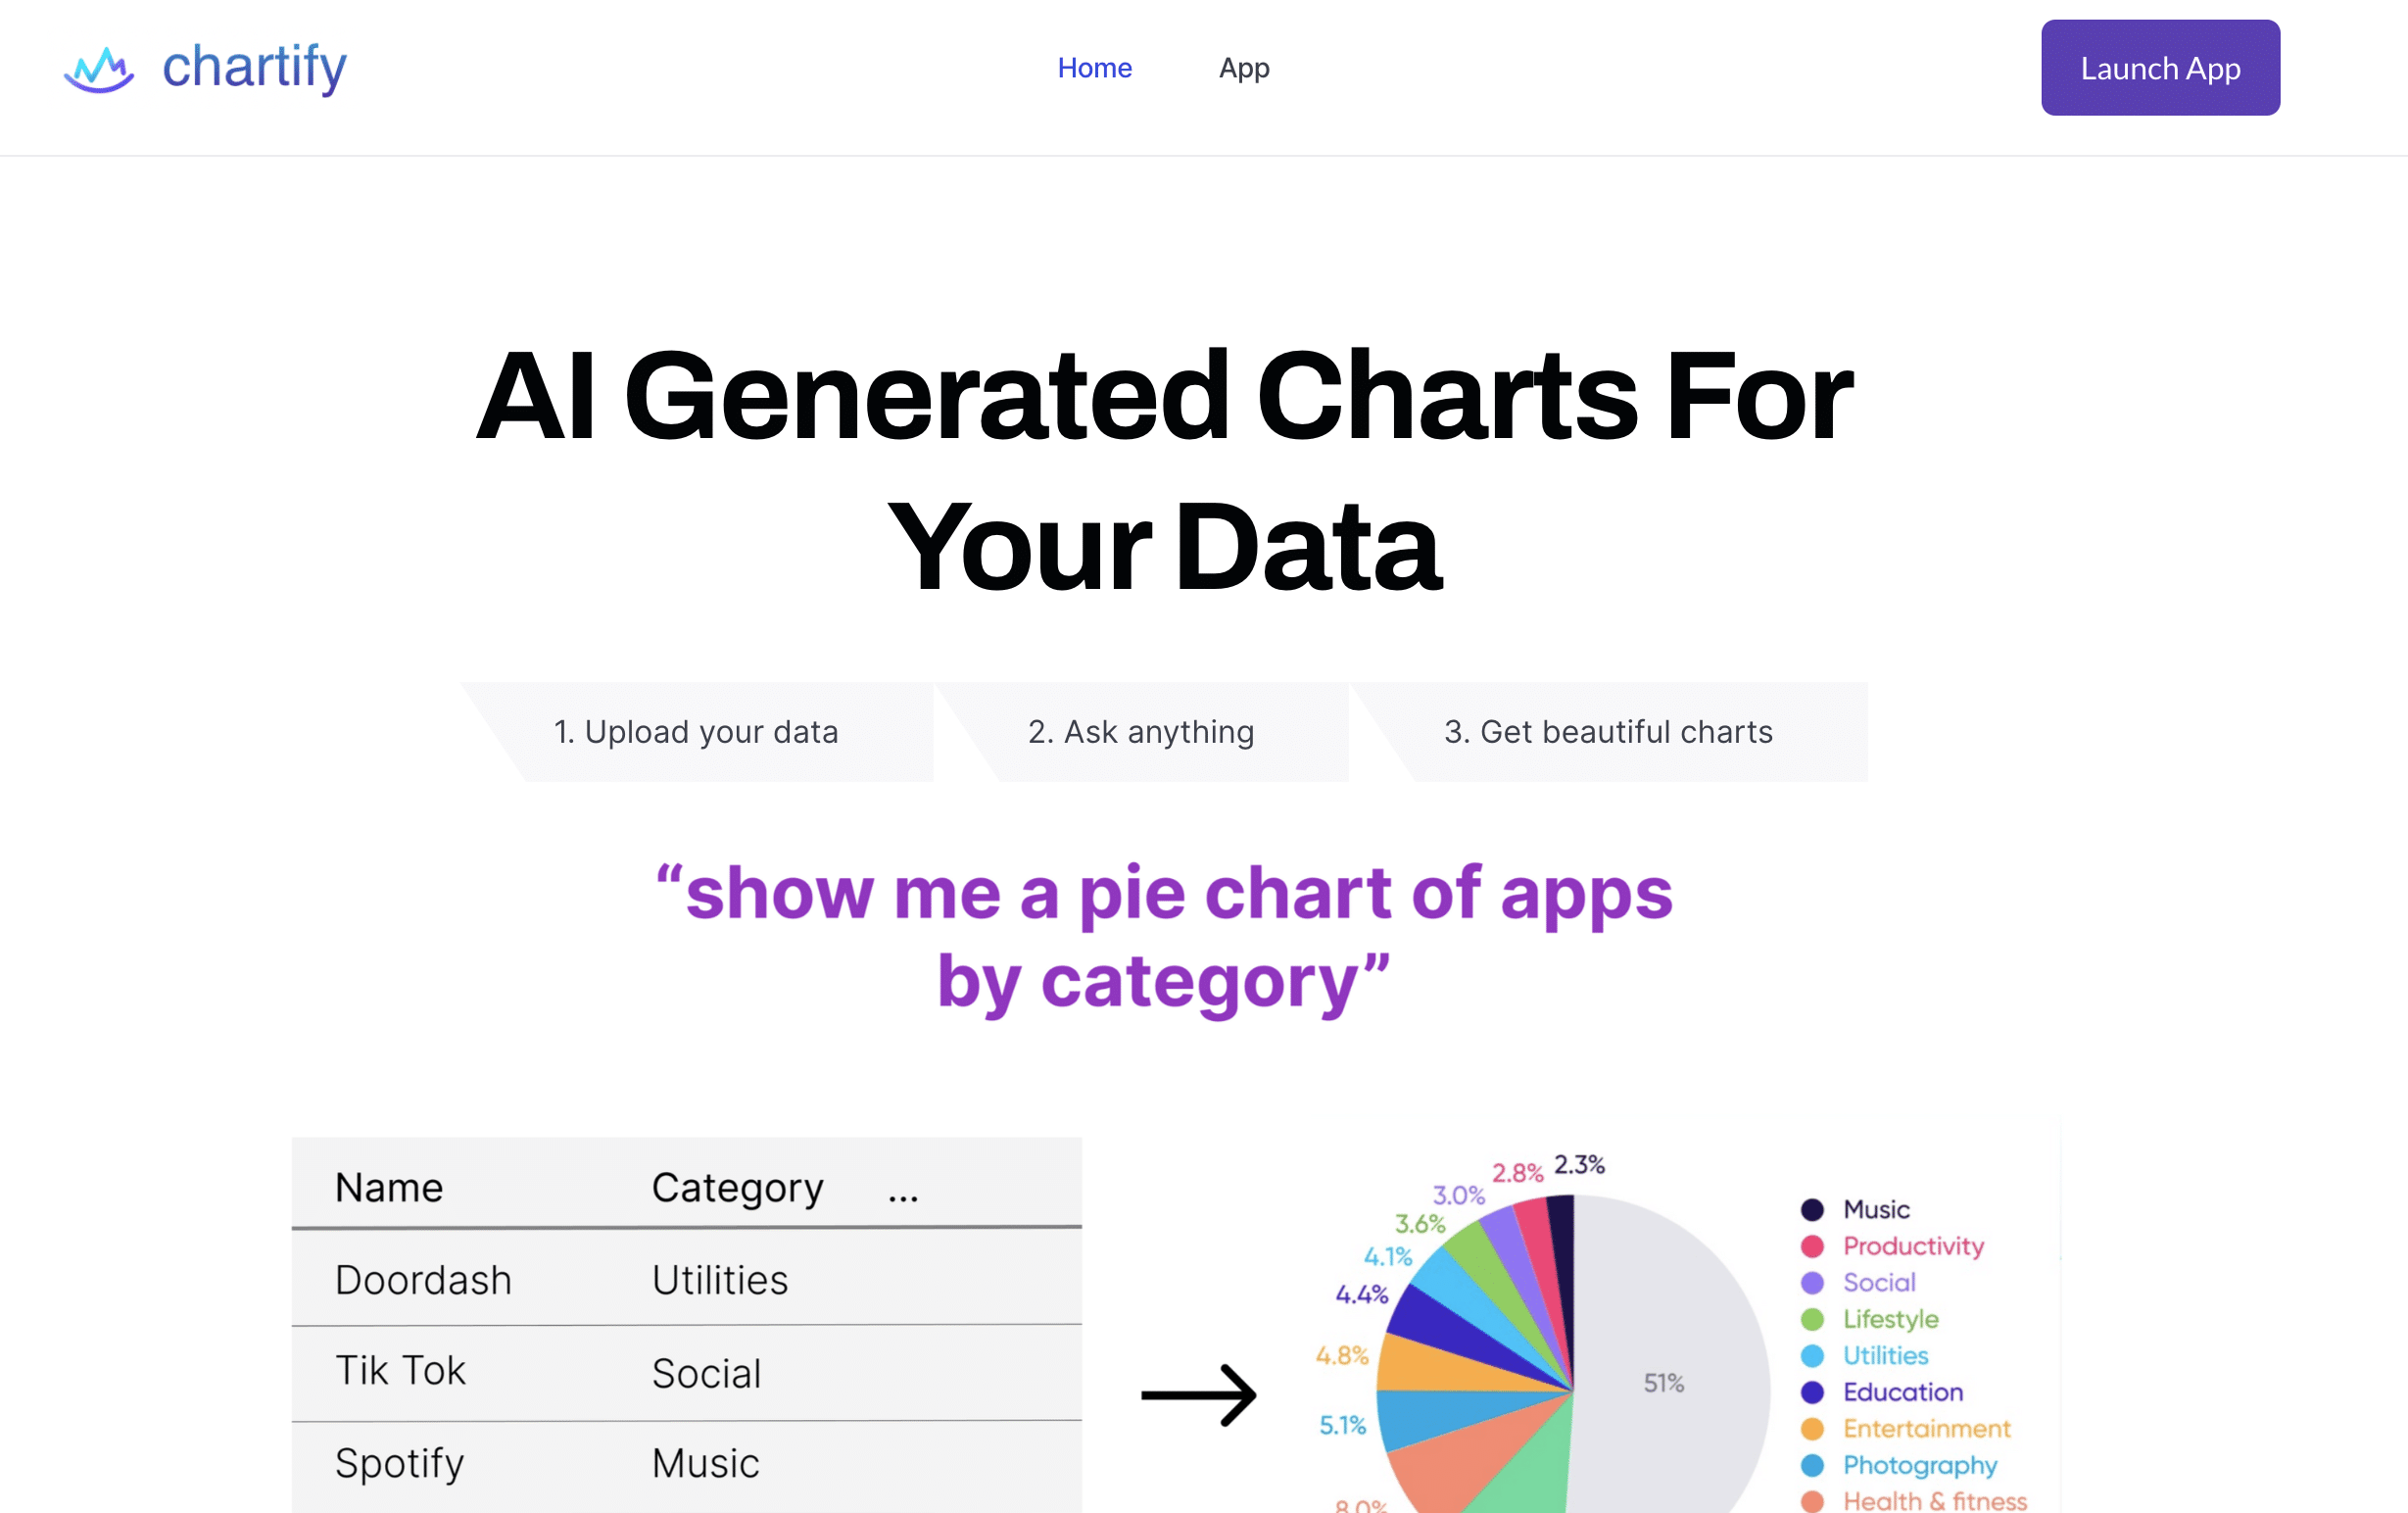
Chartify is an AI-powered tool that helps you generate interactive charts and graphs from your data. It is a cloud-based platform that offers a variety of features, including:
- Upload your data: You can upload your data from a variety of sources, including CSV files, Excel spreadsheets, and Google Sheets.
- Get recommended visualizations: Chartify will recommend the best visualizations for your data based on its type and complexity.
- Customize your charts: You can customize your charts by changing the colors, fonts, and other elements.
- Share your charts: You can share your charts on the web or embed them in your website or blog.
Use cases:
- Data visualization: Chartify can be used to create interactive charts and graphs to visualize data for presentations, reports, and other purposes.
- Business intelligence: Chartify can be used by businesses to track and analyze data to make better decisions.
- Education: Chartify can be used by teachers and students to visualize data to learn and understand concepts.
- Research: Chartify can be used by researchers to visualize data to conduct research and publish findings.
Here are some of the benefits of using Chartify:
- It is easy to use. You can start using Chartify right away, without any prior experience in data visualization.
- It is affordable. Chartify offers a free plan and a paid plan.
- It is powerful. Chartify can help you create interactive charts and graphs that are visually appealing and informative.
- It is reliable. Chartify is backed by a team of experts who are committed to providing you with the best possible service.
If you are looking for an AI-powered tool to help you generate interactive charts and graphs, then Chartify is a good option for you.
Tags

Fintwit is an AI-powered platform offering stock analysis, recommendations, and insights based on the latest trends in financial Twitter. Read More

HeyShort is an AI-powered tool that lets you turn written content into engaging short videos. Read More

Drawbert.ai is an AI tool that transforms your photos into stunning digital paintings within seconds. Read More

Vidau is an AI-powered video description generator that helps create SEO-optimized descriptions to improve video content discoverability. Read More

Deleoi.io is an AI tool that creates artistic images from your written descriptions. Read More

Humanlinker is a sales prospecting tool that uses AI to personalize outreach messages at scale. Read More

Chaindesk provides an AI-powered customer service solution that automates tasks and personalizes interactions for businesses. Read More

Younet.ai allows you to build and customize your own AI assistant by connecting your data and expertise. Read More

Tess allows artists to create illustrations in their own style using a powerful AI trained on existing artwork. Read More
Archie is an AI-powered platform that transforms your software ideas into comprehensive project plans with minimal effort. Read More