
ChartGPT
Links
Description
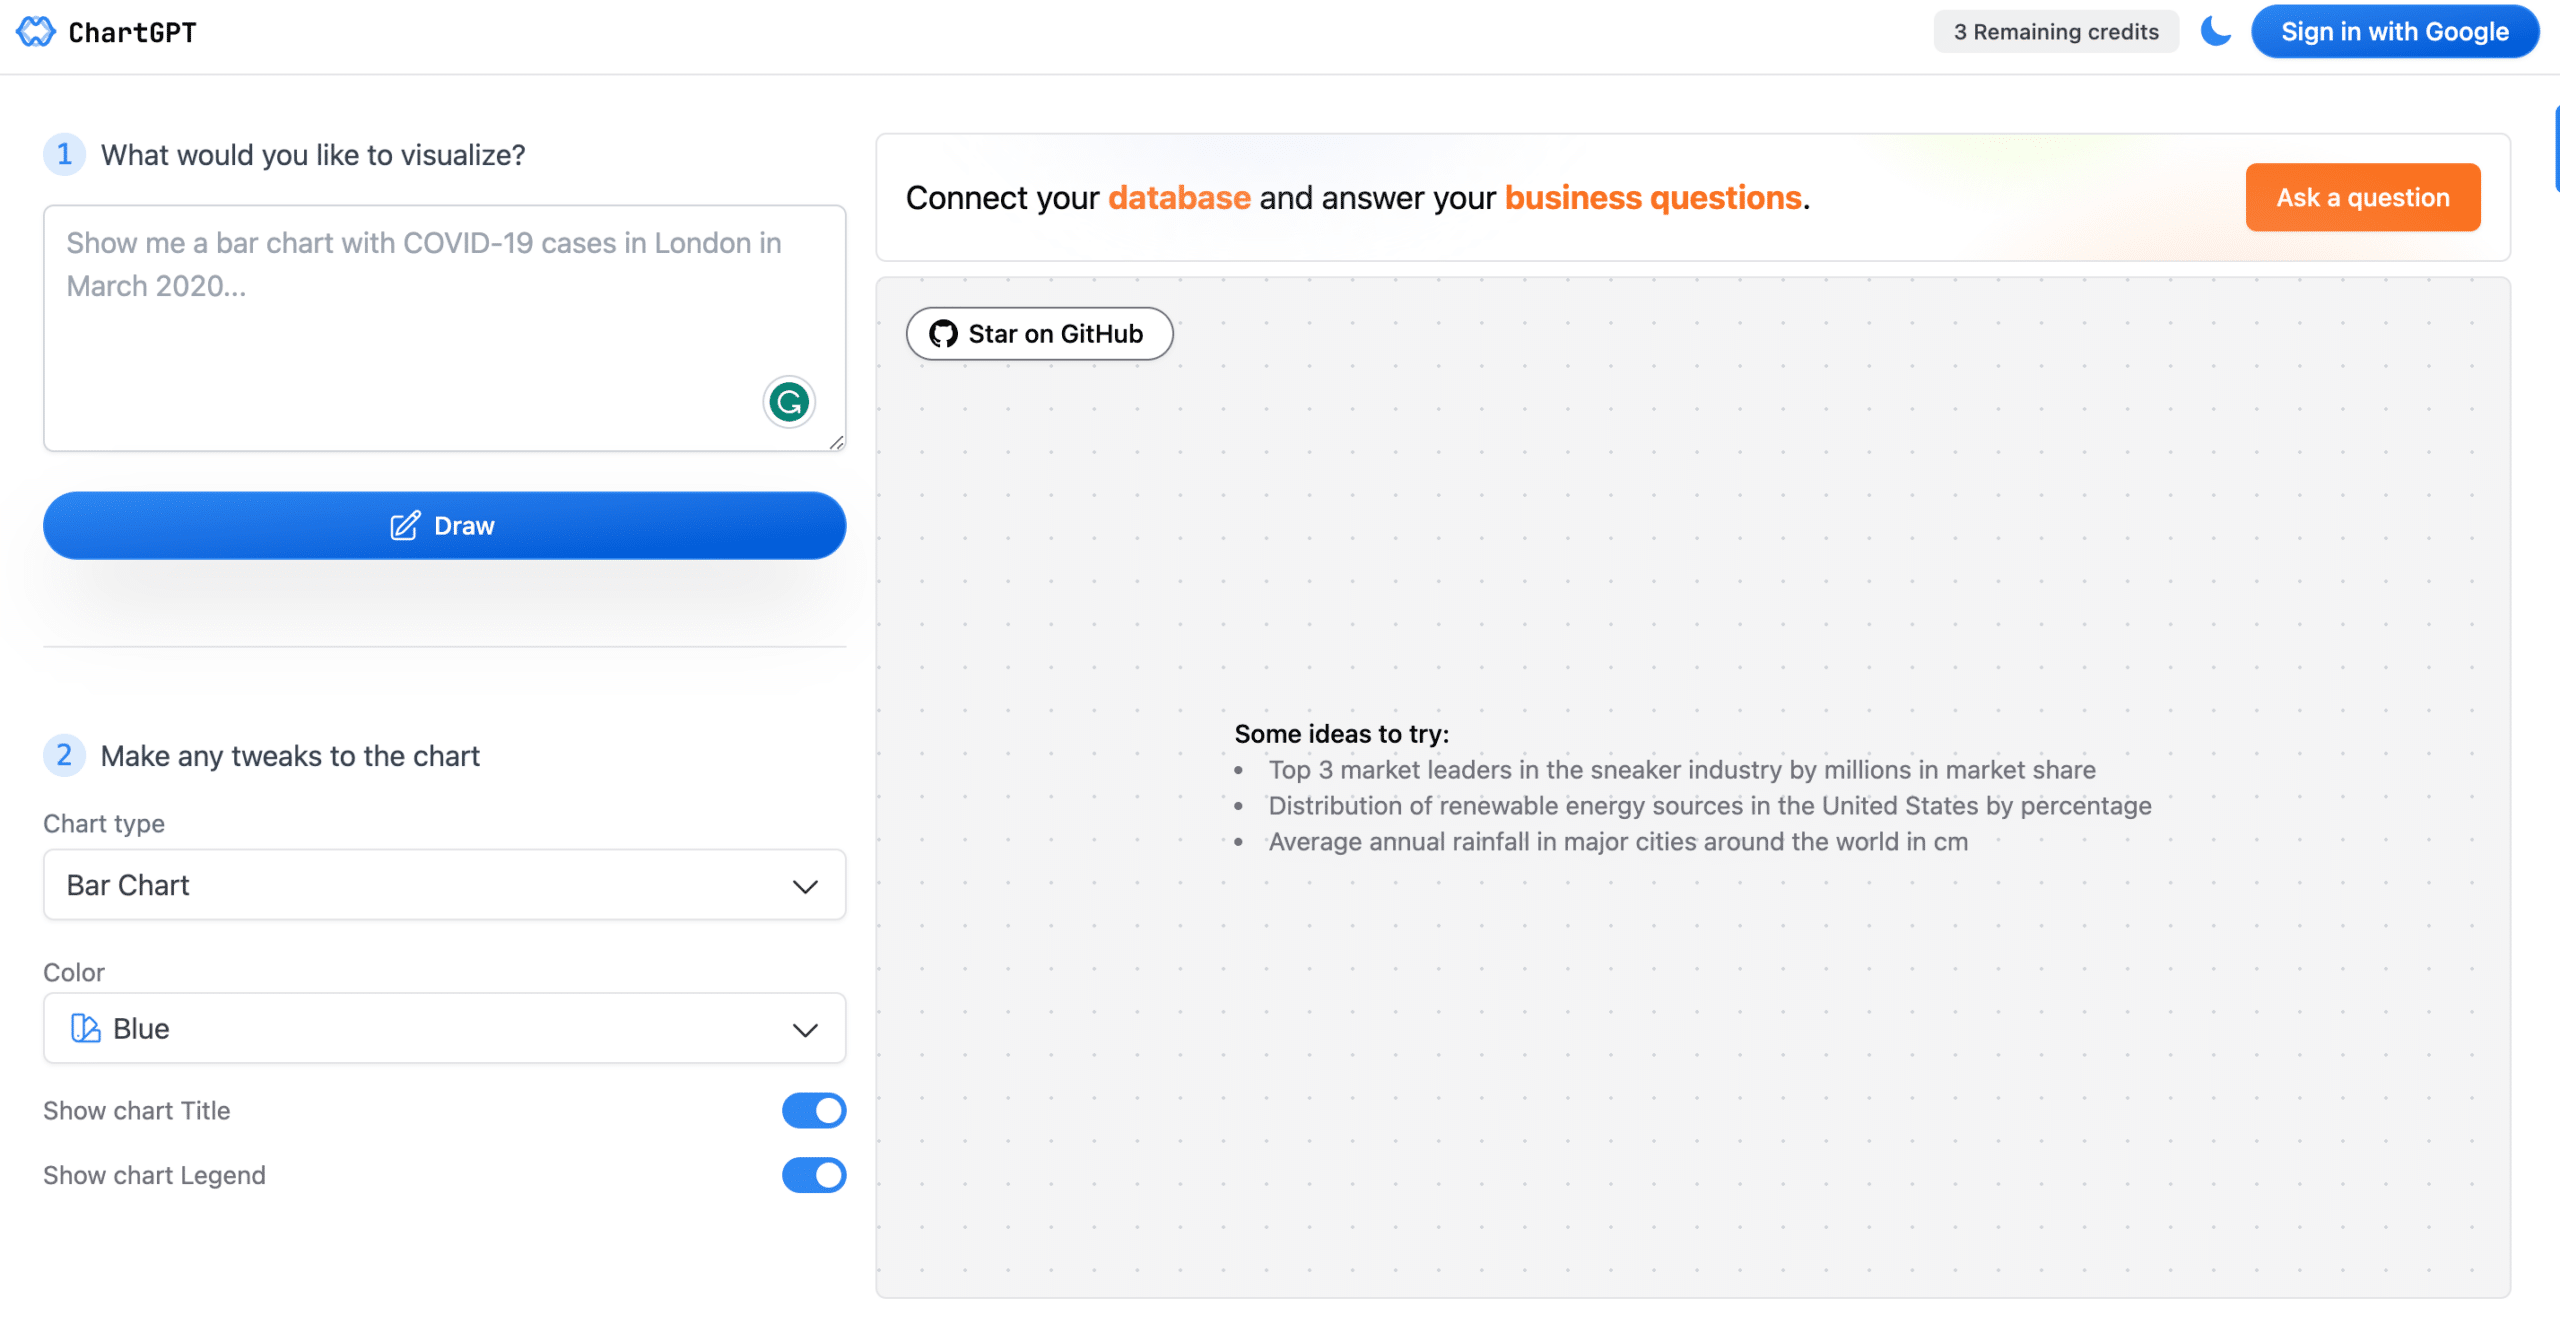
ChartGPT is an AI-powered tool that can generate beautiful charts from natural language descriptions. It uses OpenAI's GPT-3 language model to understand your natural language descriptions and to generate charts. It can generate a variety of charts, including bar charts, line charts, pie charts, and scatter plots. It is easy to use, even if you have no experience with data visualization. It is affordable, with a free tier available. It has received positive reviews from users.
Here are some of the features of ChartGPT:
- Natural language descriptions: ChartGPT can understand your natural language descriptions and to generate charts. This means that you can create charts without having to learn any data visualization software. For example, you can say "Create a bar chart showing the population of the world by continent" and ChartGPT will generate a bar chart showing the population of the world by continent.
- Variety of charts: ChartGPT can generate a variety of charts, including bar charts, line charts, pie charts, and scatter plots. This means that you can create the right chart for your data. For example, if you have data that shows how something changes over time, you can use a line chart to visualize the data.
- Easy to use: ChartGPT is easy to use, even if you have no experience with data visualization. This means that you can create charts quickly and easily. ChartGPT has a simple interface that makes it easy to enter your data and to generate charts.
- Affordable: ChartGPT has a free tier available, and paid plans start at $19 per month. This makes it an affordable option for businesses and individuals of all sizes.
- Positive reviews: ChartGPT has received positive reviews from users, who have praised its ease of use, affordability, and quality of generated charts.
Here are some of the use cases for ChartGPT:
- Data visualization: ChartGPT can be used to create beautiful charts that can be used to communicate data effectively. For example, you can use ChartGPT to create charts for presentations, reports, or blog posts.
- Education: ChartGPT can be used to create interactive charts that can be used to teach students about data. For example, you can use ChartGPT to create charts that show how something changes over time or that compare different sets of data.
- Business: ChartGPT can be used to create charts that can be used to make better business decisions. For example, you can use ChartGPT to create charts that show how your sales have changed over time or that compare your sales to your competitors' sales.
- Personal: ChartGPT can be used to create charts that can be used to track your personal progress or to make decisions about your life. For example, you can use ChartGPT to create charts that show how much weight you have lost or that track your spending habits.
Overall, ChartGPT is a powerful tool that can be used by businesses and individuals of all sizes to generate beautiful charts from natural language descriptions. It is easy to use, affordable, and offers a variety of features.
Tags

Fintwit is an AI-powered platform offering stock analysis, recommendations, and insights based on the latest trends in financial Twitter. Read More

HeyShort is an AI-powered tool that lets you turn written content into engaging short videos. Read More

Drawbert.ai is an AI tool that transforms your photos into stunning digital paintings within seconds. Read More

Vidau is an AI-powered video description generator that helps create SEO-optimized descriptions to improve video content discoverability. Read More

Deleoi.io is an AI tool that creates artistic images from your written descriptions. Read More

Humanlinker is a sales prospecting tool that uses AI to personalize outreach messages at scale. Read More

Chaindesk provides an AI-powered customer service solution that automates tasks and personalizes interactions for businesses. Read More

Younet.ai allows you to build and customize your own AI assistant by connecting your data and expertise. Read More
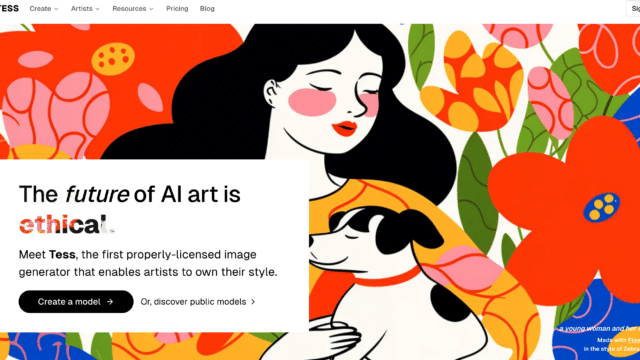
Tess allows artists to create illustrations in their own style using a powerful AI trained on existing artwork. Read More
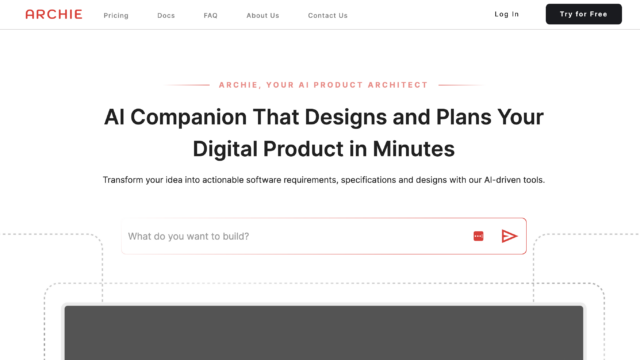
Archie is an AI-powered platform that transforms your software ideas into comprehensive project plans with minimal effort. Read More