Chartify
Popular
Links
Website
Description
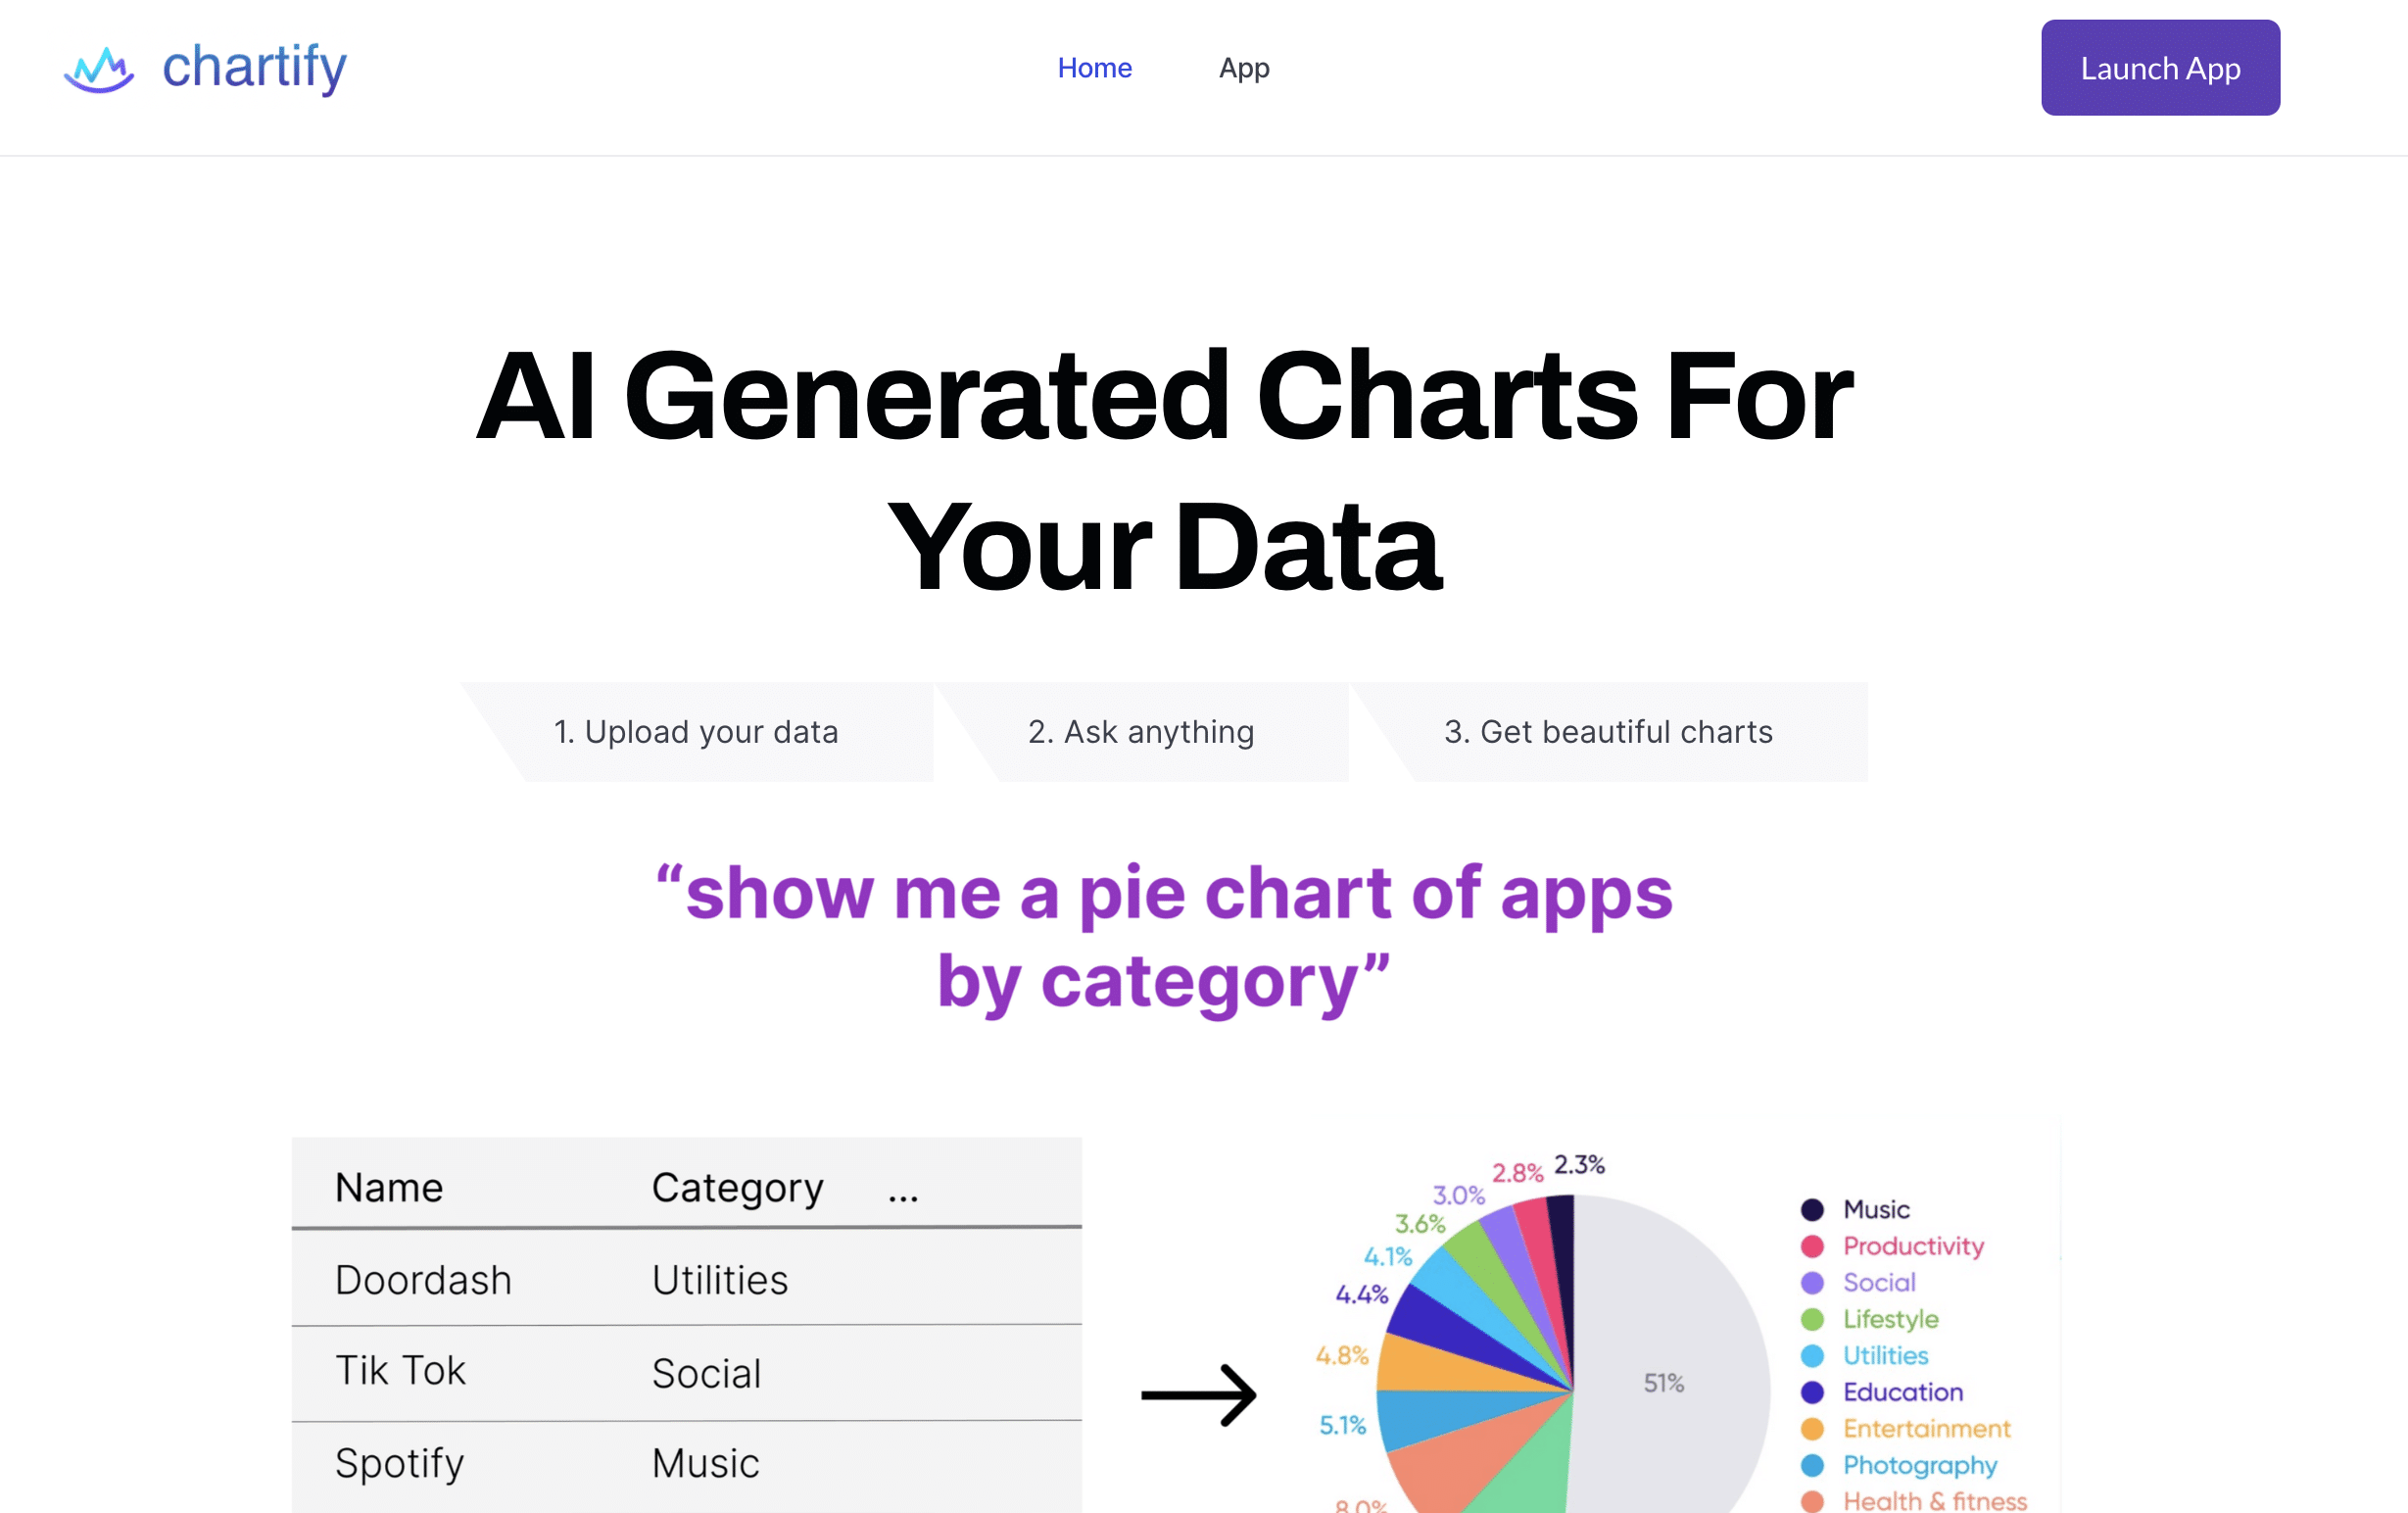
Chartify is an AI-powered tool that helps you generate interactive charts and graphs from your data. It is a cloud-based platform that offers a variety of features, including:
- Upload your data: You can upload your data from a variety of sources, including CSV files, Excel spreadsheets, and Google Sheets.
- Get recommended visualizations: Chartify will recommend the best visualizations for your data based on its type and complexity.
- Customize your charts: You can customize your charts by changing the colors, fonts, and other elements.
- Share your charts: You can share your charts on the web or embed them in your website or blog.
Use cases:
- Data visualization: Chartify can be used to create interactive charts and graphs to visualize data for presentations, reports, and other purposes.
- Business intelligence: Chartify can be used by businesses to track and analyze data to make better decisions.
- Education: Chartify can be used by teachers and students to visualize data to learn and understand concepts.
- Research: Chartify can be used by researchers to visualize data to conduct research and publish findings.
Here are some of the benefits of using Chartify:
- It is easy to use. You can start using Chartify right away, without any prior experience in data visualization.
- It is affordable. Chartify offers a free plan and a paid plan.
- It is powerful. Chartify can help you create interactive charts and graphs that are visually appealing and informative.
- It is reliable. Chartify is backed by a team of experts who are committed to providing you with the best possible service.
If you are looking for an AI-powered tool to help you generate interactive charts and graphs, then Chartify is a good option for you.


